Is it possible that those who claim the shots work and those who claim they don't might both be right? YES! It depends which data you are allowed to see
Steven Kritz, MD, just woke me up, pointing out that virtually all efficacy studies fail to extend beyond roughly 6 months, which is when efficacy turn negative and the vaccinated get sick more.
*COVID vaccines do provide brief immunity of from weeks to months.* After that, they make you more susceptible to catching COVID.
This is very important. If only short-term studies are being presented to judge vaccine efficacy, it might look fine. Especially in the best age groups. Canadian and UK data were showing poor efficacy in longer-term datasets. Then both went offline and were no longer publicly available. So most people have been told the vaccines work well, and given piles of short-term data that appear to be convincing. Unless you start asking why boosters were recommended in August 2021, only 8 months after the initial vaccines rolled out. Or you demand to see longer-term data.
Consider saving this post to show your friends who believe the vaccines worked wonderfully well.
Below are some graphs I saved because they were rarities and helped make this point.
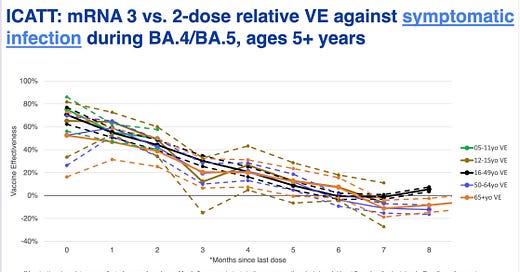
1. The graph below was shown at a CDC ACIP (Advisory Committee on Immunization Practices) meeting in 2022 that I attended online. I screenshot the graph, which had not been published. It is not clear whether the presence of 2 lines for some age groups represented confidence intervals. What is important is that this is CDC’s own data, which made it through considerable review in order to be presented.
Essentially the graph shows you vaccine effectiveness dropping considerably month by month after initial vaccination, with different colored lines representing different age groups. By 6-7 months effectiveness is zero. Effectiveness seems to hover at a mildly negative amount (indicating a slightly increased risk of COVID infection compared to the unvaccinated) but the data cut off at 8 months.
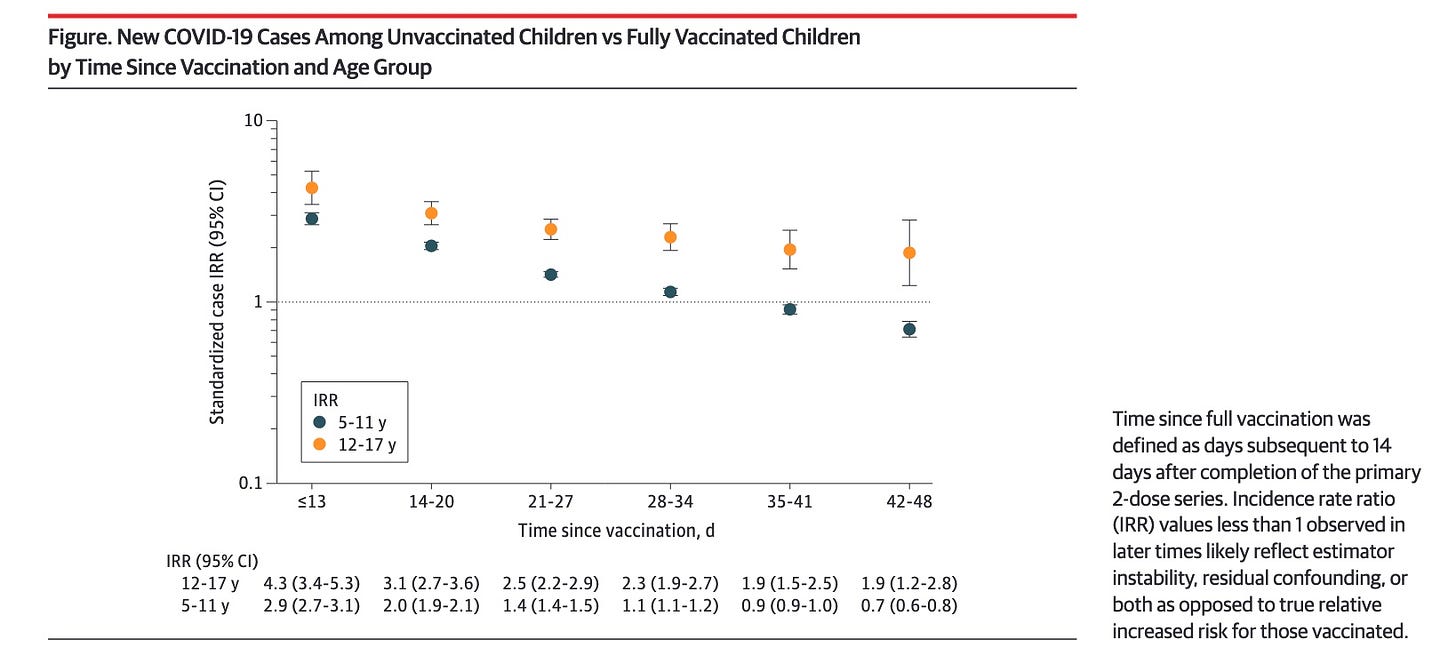
2. Below is one of my favorite graphs of the pandemic, published in JAMA with first author Dorabawila. These data include every fully vaccinated child and unvaccinated child in New York State, 2,423,585 children aged 5-17. New York had the date of vaccination for each child, and the dates they had positive or negative COVID tests. Because there were so many children’s data included, the lines are so straight and the confidence intervals so small. This means the data were internally consistent and extremely reliable.
This is how you do science if you are serious. These NY state public health officials linked 4 databases to best study the questions they were asking:
Four NYS databases were linked to examine COVID-19 outcomes among children 5-17 years. The Citywide Immunization Registry (CIR) and the NYS Immunization Information System (NYSIIS) collect COVID-19 provider vaccination data for residents of New York City and the rest of NYS, respectively. The Electronic Clinical Laboratory Reporting System (ECLRS) collects all reportable COVID-19 test results. The Health Electronic Response Data System (HERDS) includes a statewide, daily electronic survey of inpatient facilities, including all new admissions with laboratory-confirmed COVID-19 and the primary reason for admission.
If you study the graph below closely, you will see that the children were divided into 2 age groups, which makes sense because each group received a different dose of vaccine. You will also see that efficacy was higher in the 12-17 year group, which received 30 mcg of the Pfizer vaccine’s mRNA (the adult dose) while the younger kids got 10 mcg per shot.
The time since vaccination, along the X axis, is in days. The timeline ends at 48 days post vaccination, a day short of 7 weeks—not even 2 months! At 5 weeks the IRR is already negative for the younger children, but some efficacy remains, falling more slowly, for the older children.
At 13 days, the younger vaxxed kids are only 1/3 as likely as unvaxxed to get COVID. At 2-3 weeks they are 1/2 as likely to get COVID. By about 35 days they are just as likely (IRR = 1) as the unvaccinated to get COVID, and after that, more likely.
The older kids’ immunity starts out higher, and also wanes, but more slowly.
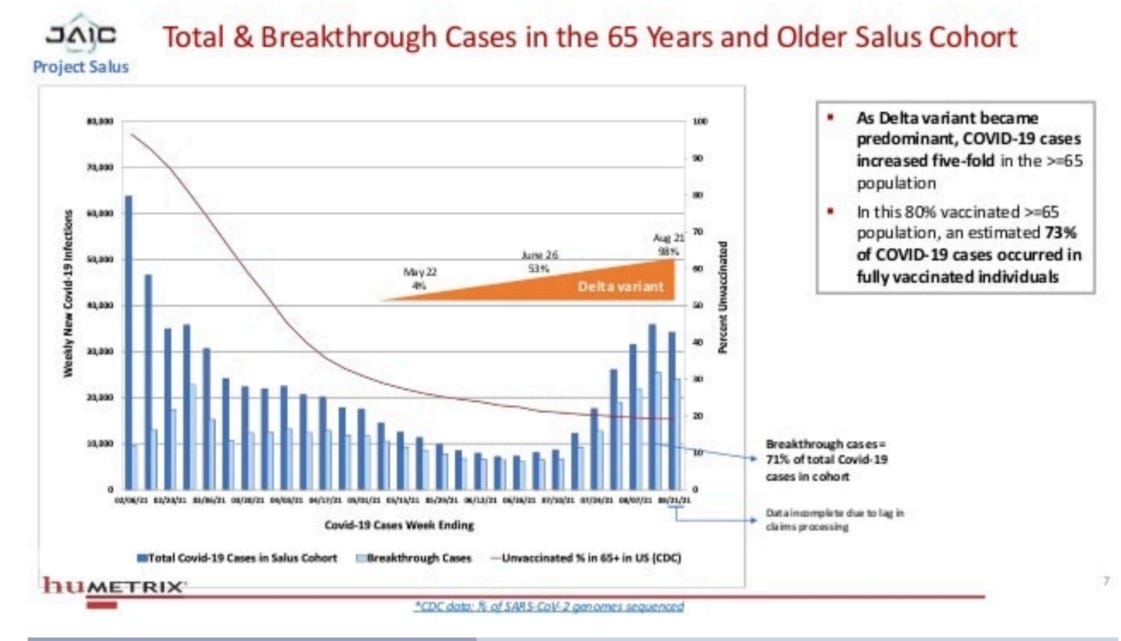
3. The graph below was from a leaked military contractor deck, using CDC data. It showed that in an 80% vaccinated elderly population, as the Delta variant appeared, 73% of cases occurred in the fully vaccinated, indicating very little efficacy. I cannot read the timeline below, but Delta caused the majority of US cases in July 2021, seven months after the vaccine first rolled out. So the cases could be due to the Delta variant breaking through vaccine protection, or vaccine protection waning after roughly six months, or both.
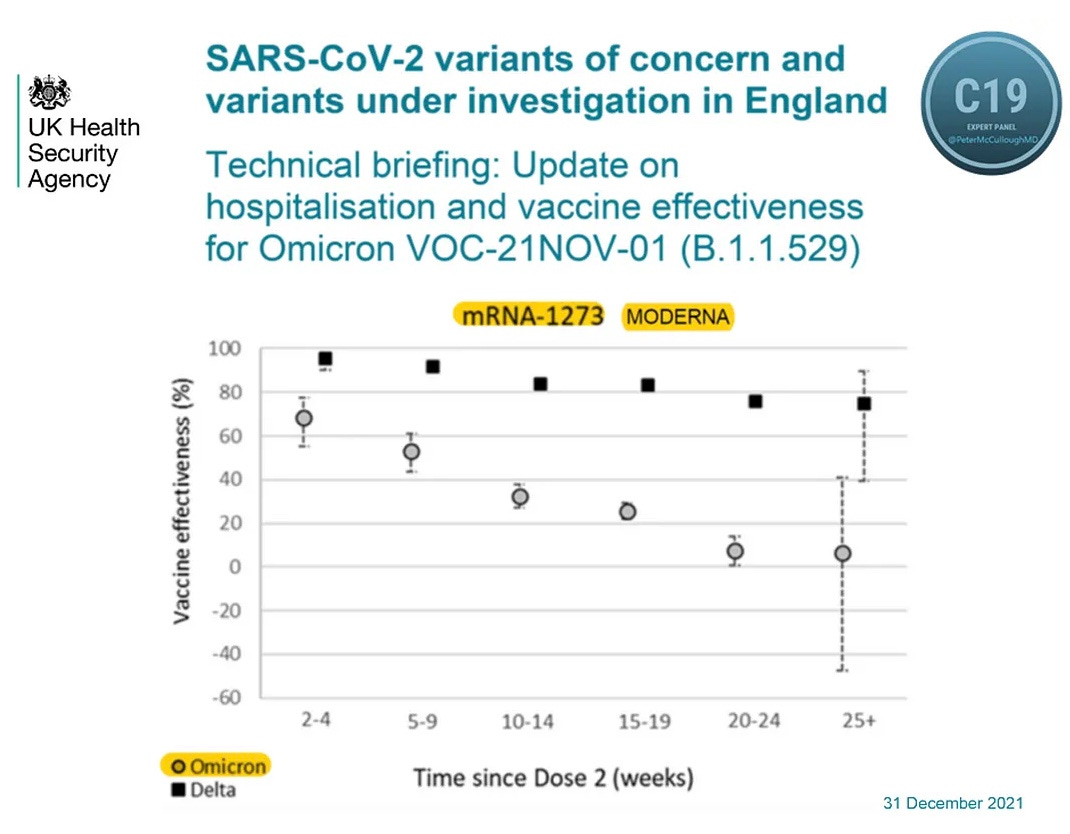
4. In this UK government dataset, which I believe looked at the effectiveness of the Moderna vaccine at keeping people out of the hospital, it was found that the vaccine worked fairly well—it was said to be 75% effective at 25+ weeks for the early COVID strain. However, when Omicron appeared, effectiveness at 20-24 weeks and 25+ weeks had fallen to near zero. The graph ends at the approximate 6 month/26 week mark.
I have been challenged by readers recently for acknowledging that the COVID vaccines do provide brief immunity to COVID, which varies by COVID strain, type of vaccine, dose size, age of recipient and the length of time since the last vaccine dose.
I hope these graphs make clear that such brief immunity is very poor, lasting for less time than any other licensed vaccine—at least any licensed vaccine before 2019, when FDA started licensing Ebola and Monkeypox vaccines with marginal data. None of the studies above looked at safety, which is obviously a huge problem.
The EUAs were issued with a mean followup time of two months, and the FDA claimed, in its response to our Citizen Petition, that the vaccine had at least 50% efficacy, in order to meet the standard FDA required. It looks to me like 2 months was chosen because after that, the 50% standard could not be met.
I hope I have convinced you that when vaccine effectiveness is judged at one point in time, or for very brief periods, COVID vaccines can be made to appear reasonably effective. So we need to point out the insufficiency of the data collection when confronted regarding efficacy.


From 2 weeks to 6 months after the second mRNA shot, the average recipient is less likely than a non-recipient to be diagnosed with COVID. (albeit more likely to have myocarditis, clotting disorders, strokes, heart attacks, cancer and autoimmune disease, and "excess all-cause mortality").
Before becoming "fully vaccinated" at 2 weeks after the second injection, the injected person is a lot more likely to "die suddenly", and also have that same litany of things-not-COVID.
Beyond 6 months after the "fully vaccinated" honors, the person still has all the excess mortality risk, and may have discovered "long vaccine syndrome", and still has more chance of having the other special effects the spike-protein was engineered to cause within the human body.
Read the real “turtles all the way down”. Vaccine history is riddled with rigged studies.